User can create custom widgets to the dashboard with the dashboard widget wizard. Wizard is also a tool to modify existing widgets on the dashboard. Instead of creating entirely new widgets, it is possible also to add preconfigured widgets from the widget gallery or copy widgets from the other dashboards.
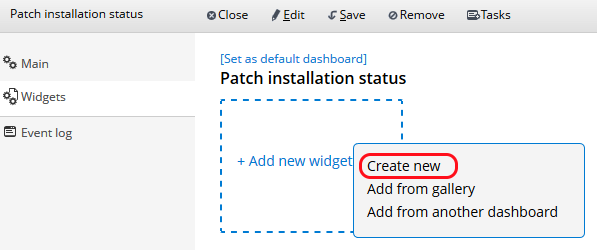
When you want to create a new widget, enter into the Edit mode on dashboard, click on the + Add new widget here area, and choose Create new to start the creation of a new widget.
If you want to modify the existing widget,on a dashboard, click the Edit icon on the right hand corner of the widget to open the widget wizard. See more information from the article Editing custom dashboards and widgets.
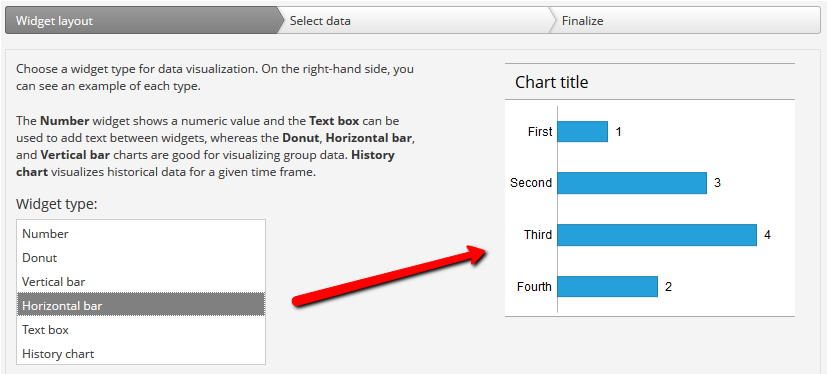
You can see a preview of each widget type on the right when you click on it.
If you want to create a widget with history data, see Creating
a dashboard to display historical data.
In this step, you can define what configuration items are included in the widget data, how the data is grouped and whether you want to use a certain function to calculate something over the selected items. See examples below.
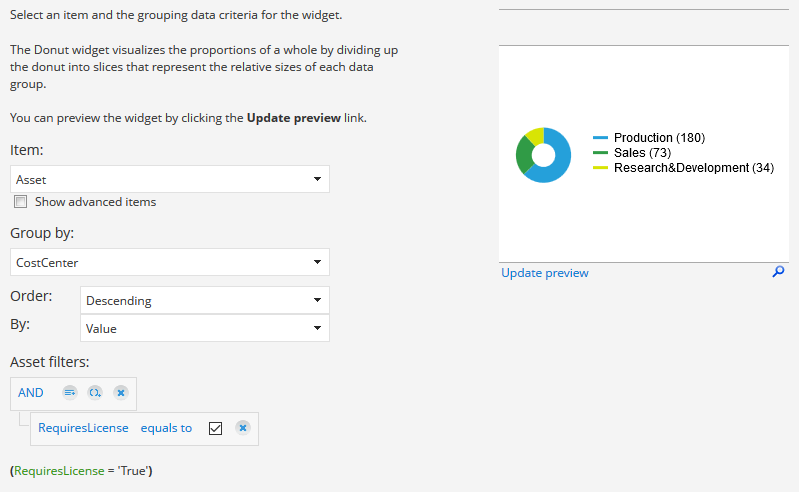
Example 1: The count of items grouped by selected criteria
This widgets uses the Count function and asset filters to get the number of assets which require a Miradore license. The data is then grouped by cost center in a donut chart.
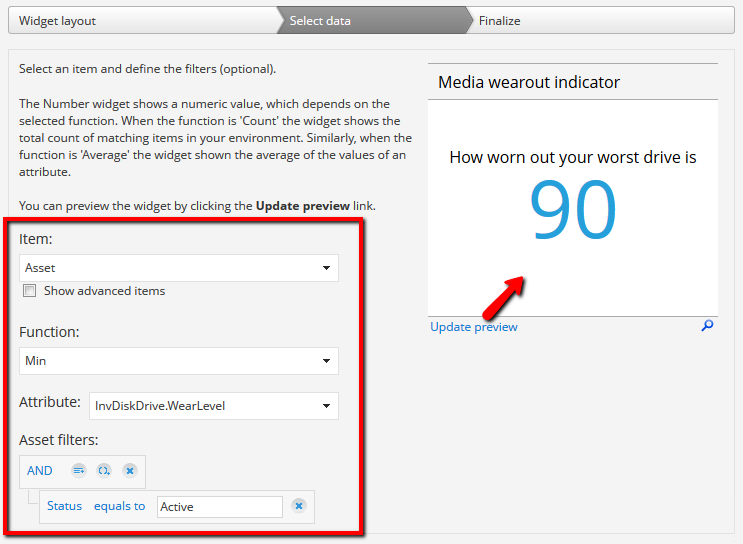
Example 2: The lowest value of an attribute in selected items
This widget uses the Min function to show the minimum value of InvDiskDrive.WearLevel attribute over all active assets (Max function would show the highest value). This means that the widget shows you the condition of the most worn-out hard drive in your managed devices. Value 90 means that even the worst drive is still in pretty good shape because the wear-out indicator starts at 100 and decreases over time.
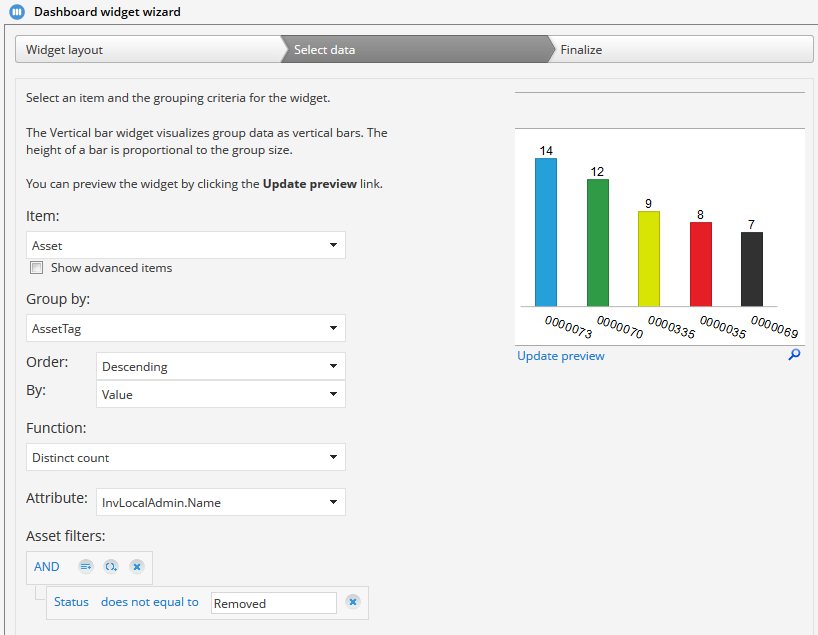
Example 3: Total number of unique values for a given item attribute in selected items
This widget utilizes the Distinct count function to get the number of unique local administrator accounts for asset configuration items. The number of local admin accounts is then grouped by asset tag and listed in descending order in a vertical bar chart.
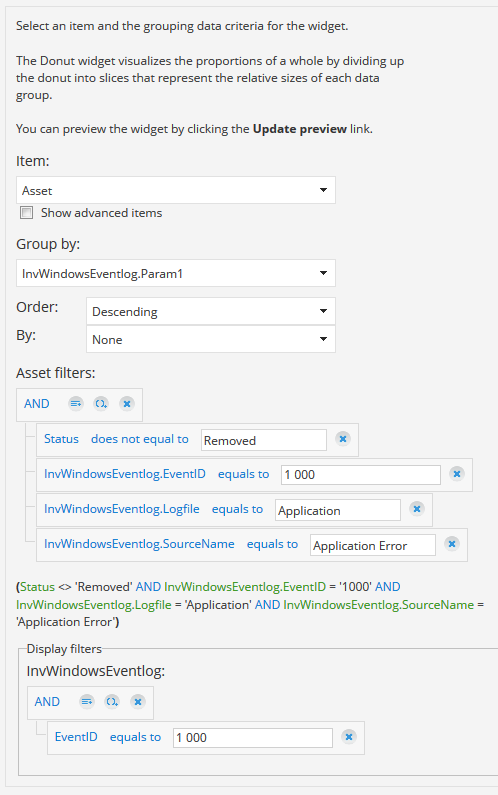
Example 4: Top crashing applications
This widget uses the Windows event log entries to collect a crash report about applications that crash most often.
Example 5: History data over last month
This is a history chart which displays the number of devices which have had Windows stability score less than six during the last month. Notice that you can use the radio buttons and the drop-down menu to select some of the system's default history data sources to the widget, or you can also create your own history data collector.
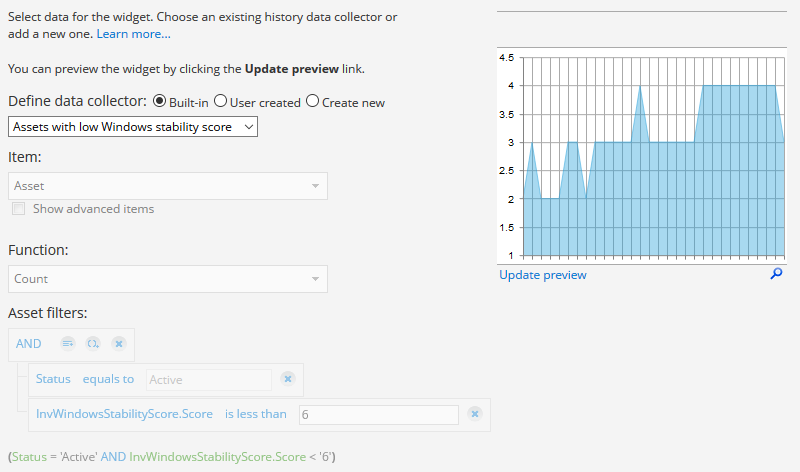
More information about Creating a dashboard to display historical data.
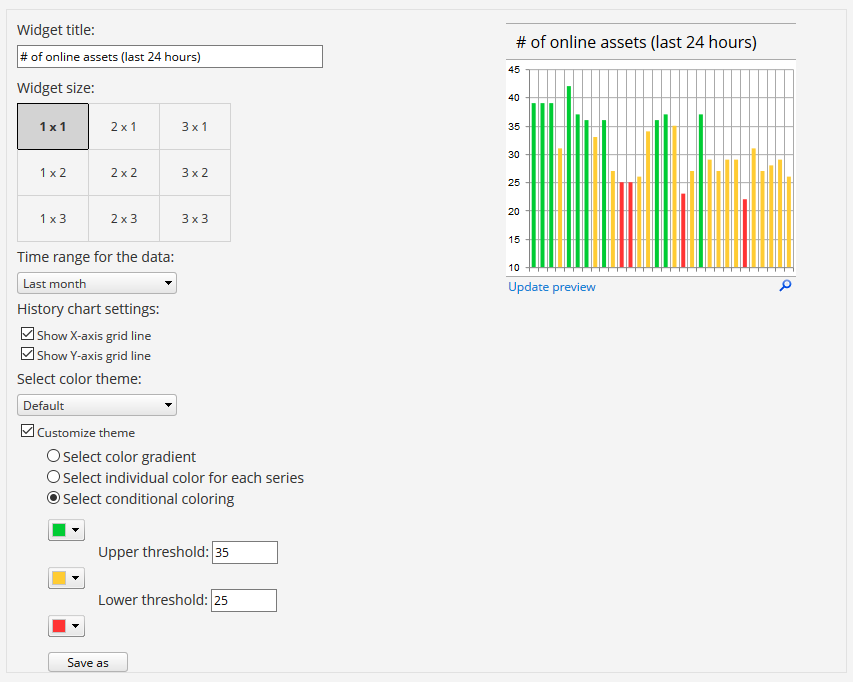
In the final step of the wizard, you can customize the widget's visual appearance. You can for example define the size and the colors of the widget. There are some alternative color themes in the system, but using the Customize theme and Save as options you can also add your custom color themes to the system. With the conditional coloring option, you can automatically apply conditional formatting to widget data, because it lets you define widget colors that change based on the widget values.
Notice
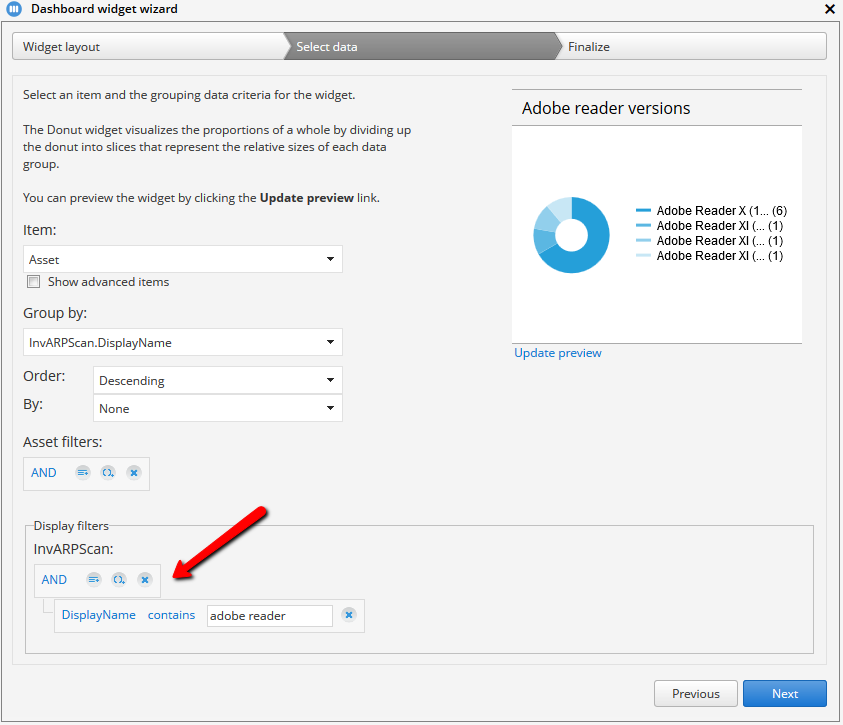
Also when selecting the widget data, some of the inventory attributes in the Group by selection list support Display filters which appear under the Asset filters when available (see picture below). The display filters are intended for filtering one-to-many type of data rows. For example, one computer usually has multiple different software installed, but if you're interested in one specific software, you can filter the other software out from the results.
The display filters don't affect to the data set returned by the SQL query, but they only determine what is shown in the widget. For example, in the picture, we have defined a display filter which only shows the Add/Remove program scan results whose name contains adobe reader.
Related to
See also
Add widget from the widget gallery
Add widget from another dashboard
Creating dashboards to display historical data
Editing custom dashboards and widgets
Editing report filters manually