Configuring monitors
When event monitoring feature of Miradore is enabled, all monitors are listed on the Monitors view. The view can be used to enable/disable and configure the settings of the monitors. If a monitor is enabled and it detects a problem that corresponds with the configurations of the settings, the monitor generates a new event. All events generated by the monitors are listed on the Event queue view.
How to enable/disable monitors
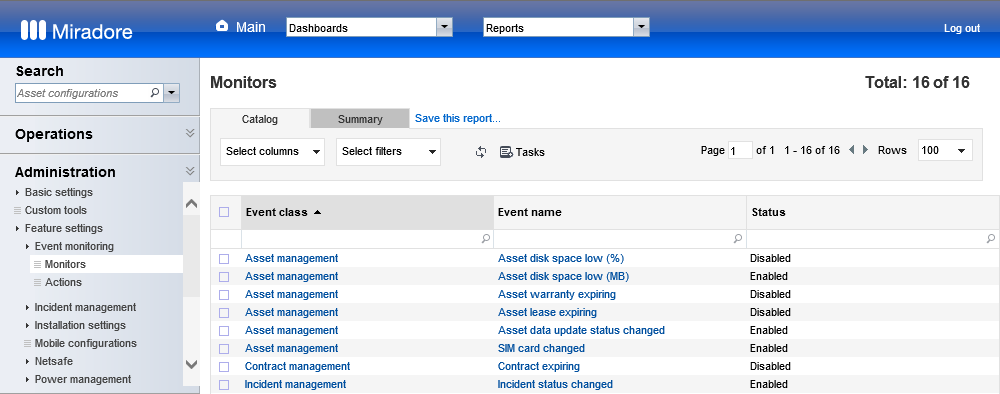
Navigate to Administration > Feature settings > Event monitoring > Monitors in the management console of Miradore to see the monitors that have been created into Miradore (Picture 1). The 'Status' column shows whether a monitor is disabled or not. Notice that only enabled monitors are used to generate new events into the Event queue.

Picture 1: Monitors view lists all monitors that can be used to watch the health of Miradore environment and the configuration items within the environment. The 'Status' column quickly shows which of the monitors are enabled/disabled.
The monitors can be enabled/disabled by selecting Tasks > Change status from the Monitors view or by opening the configuration item form of the monitor and using the Tasks menu of the item (Picture 2).

Picture 2: The Tasks menu of the Monitor item allows to enable or disable the monitor.
Setting up a monitor
There are two types of event monitors in Miradore: event log monitors and configuration item monitors.
Event log monitors
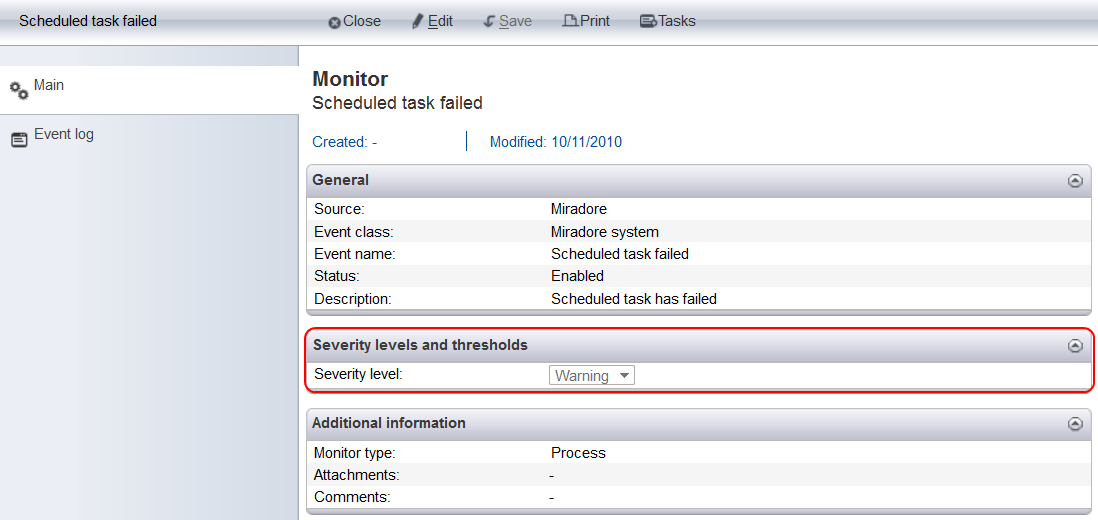
The event log monitors are configured to watch certain processes for changes or failures. If the monitor detects a change or failure, it generates a new event. The severity level of the generated event depends on the 'Severity level' -setting of the monitor (Picture 3).

Picture 3: The 'Severity level' attribute of the monitor determines the severity level of the new event that is generated when the monitor detects that a scheduled task has failed. The severity level -setting is outlined with red colour in the picture.
Configuration item monitors
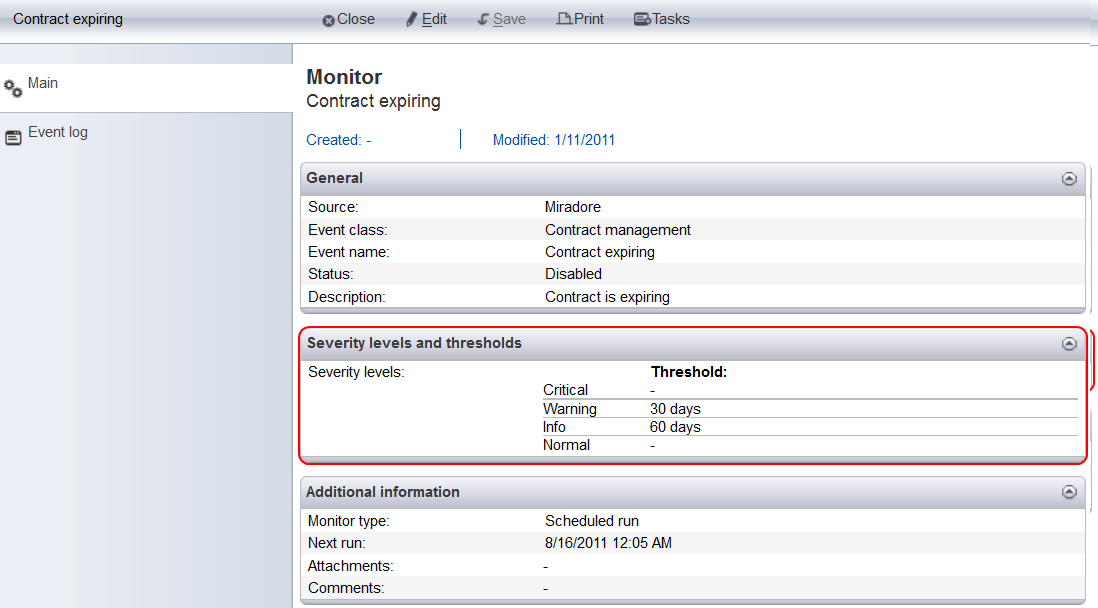
The configuration item monitors are configured to follow a certain attribute of a configuration item. This type of monitors generate a new event when the attribute achieves a predefined threshold value. Thus, the severity of the generated event depends on the threshold value -settings that have been defined to the monitor item (Picture 4). A typical example of a configuration item monitor is a monitor that tracks the validity period of contract configuration items and generates new events according to the amount of days that are left of the validity period of a contract.

Picture 4: The 'Severity levels' fields determine the severity of new events that are generated by this monitor item. In this picture, the monitor is configured to generate a new 'Info' level event when there are 60 days left of a contract and 'Warning' level event when there are 30 days left of the contract period.
The severity level for each monitor item can be edited in the Edit -mode. Always select the monitor threshold values with caution.
See also