Computer health monitoring
Miradore collects hundreds of inventory attributes about your devices, including changes that can be used for monitoring the health of your devices. This article contains some examples how you can visualize the data using the widgets included in Miradore's widget gallery.
You can also build your own dashboard widgets to visualize the data if you can't find a suitable widget from the gallery.
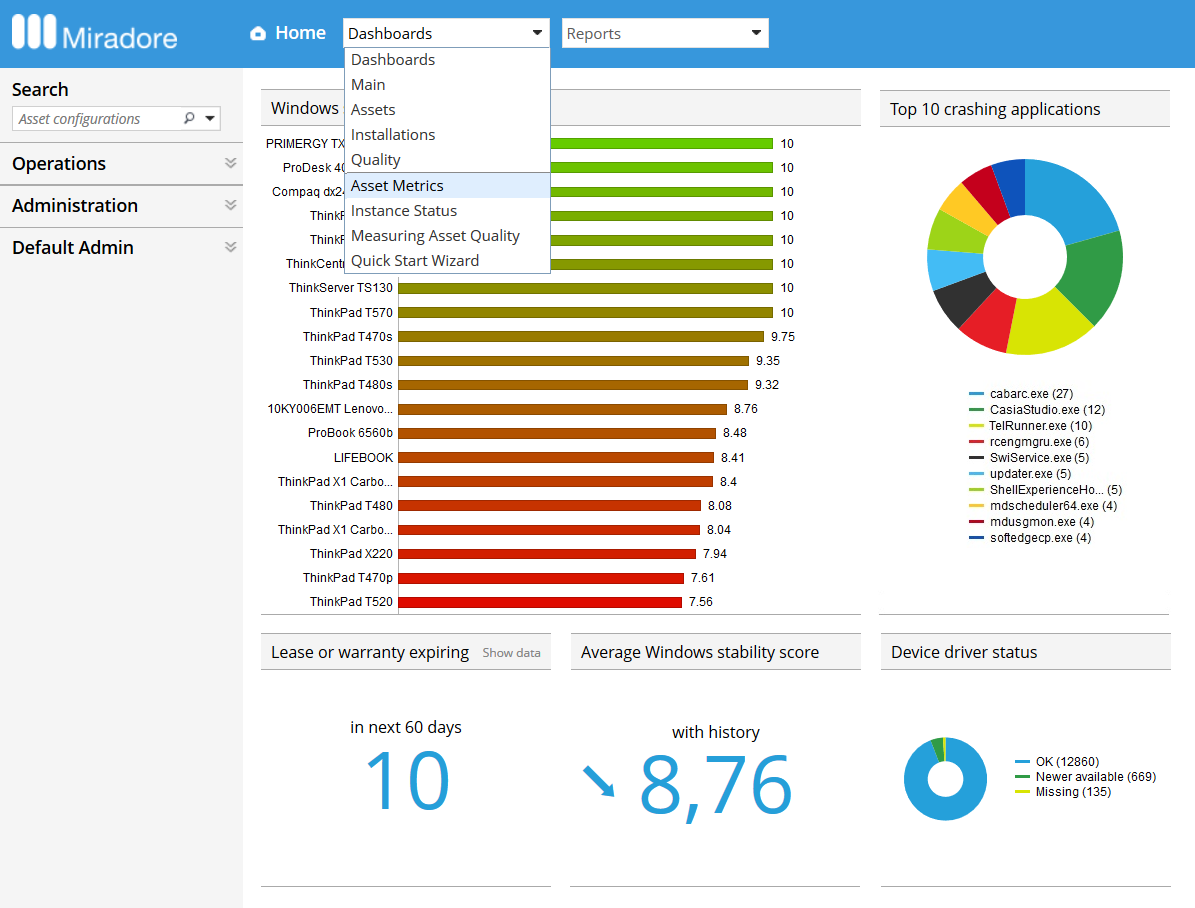
Out-of-the-box dashboards
Miradore Management Suite comes with some reporting dashboards by default. You can access the dashboards through the Dashboards menu. You can see the data behind a widget if you click on the widget.
Widget ideas
Application crashesThe most often crashed Windows apps in your managed devices.
|
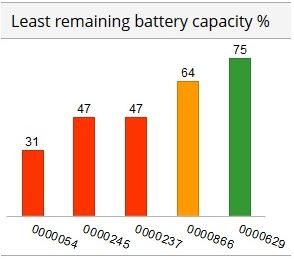
Battery healthHealth and status information of batteries in Windows, Linux, and macOS laptops.
|
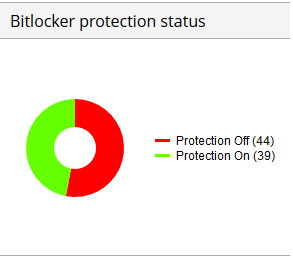
Bitlocker encryptionHow many of your devices have the Bitlocker disk encryption enabled.
|
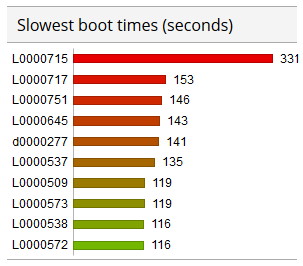
Boot durationAverage or slowest boot duration by device model or by each device.
|
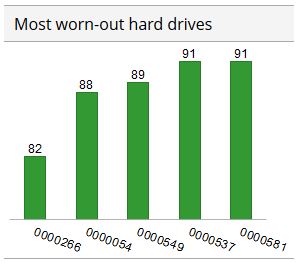
Disk health (SMART)Health and reliability information of hard drives in Windows, Linux and macOS computers.
|
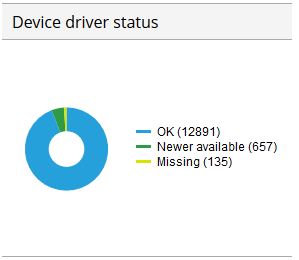
Device driversAre your devices missing drivers or is there a newer driver version available?
|
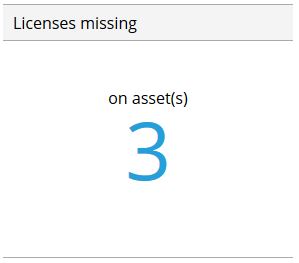
License complianceSoftware license compliance status on your devices.
|
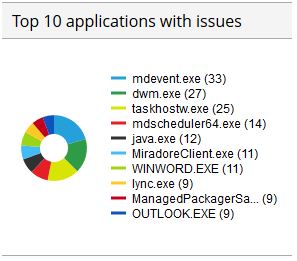
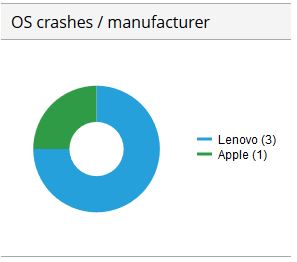
Operating system crashesWindows event log entries about OS and application crashes on Windows computers.
|
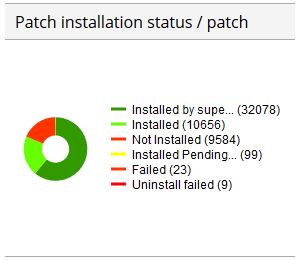
Patching statusPatch installation status throughout your device fleet.
|
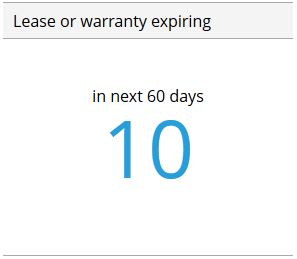
Warranty or lease expirationThe number of devices whose warranty or lease contract is about to expire.
|
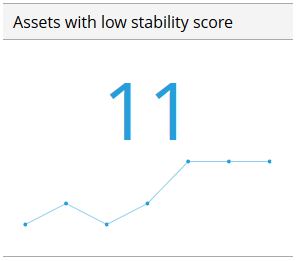
Windows stability scoreDevices with Windows stability score index lower than defined threshold.
|
|
Additional keywords: data analytics, diagnostics, pre-emptive maintenance, visualized data, data-driven, measure