Dashboards view
About
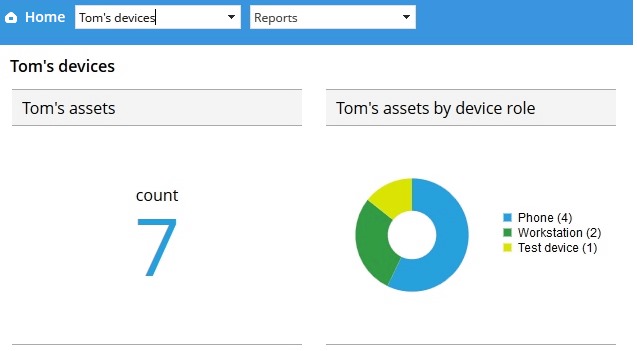
Dashboards provide information about your environment in form of easy-to-understand visual graphs and tables (picture below). Each dashboard has a set of quick, easy to understand parameters of the environment displayed in graphical form.
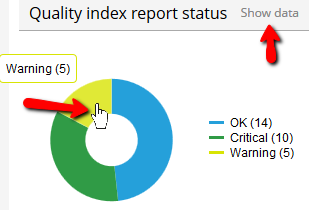
Logged in Miradore users have the possibility to drill down in a Dashboard widget to see the detailed data behind the visualization. Clicking on a certain graph slice or column shows the data for that specific part of the chart, whereas clicking the "Show data" link takes the dashboard viewer to a report with all data.
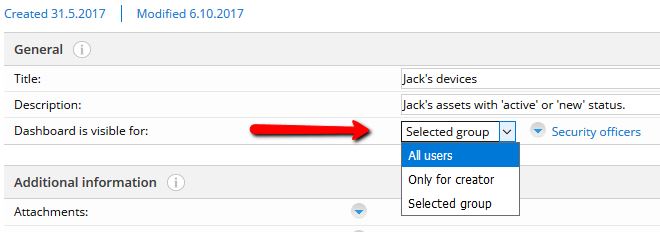
In the Administration > Dashboards view, Miradore administrators can create custom dashboards for their Miradore Management Suite instance, and define which users or user group are allowed to view the dashboard.
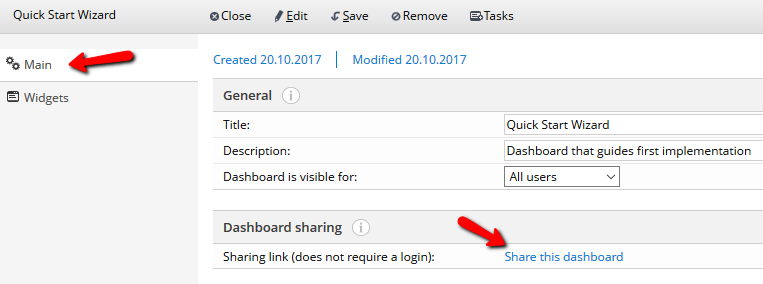
Administrators can also share the dashboards over URL to non-Miradore users who can connect to Miradore Management Suite server. Notice that users without a Miradore account cannot drill down in a widget to see the detailed row data behind the visualization.
Further instructions and more information:
Setting the default dashboard for all users
Exporting and importing dashboards
Location in navigation menu
Administration > Dashboards
View content
|
Section |
Available attributes |
|
Catalog columns |
Accessible for, Created by, Description, Is default, Shared, Title, Widget count |
|
Summary dimensions |
- |
|
View filters |
Accessible for, Created by, Description, Is default, Shared, Title, Widget count |
Note! this may not be the full list of available attributes
View properties
|
Property |
Description |
|
Data update interval |
- |
|
Data calculation interval |
- |
|
Excluded items |
Miradore Management Suite's built-in dashboards are not listed in this view. You can view the built-in dashboards through the Dashboards drop-down menu which is located in the top pane of Miradore user interface. |
|
Default filters |
- |
View tools and actions
|
Task |
Description |
|
Create new |
Creates a new custom Dashboard item. |
|
Export |
By default, this task exports all the view contents in the selected file format. However, you can use the check boxes in the view to export selected rows only. You can select rows for the export from one page of the view at a time. The supported file formats for the data export are CSV, Excel, and PDF. In some views, configuration items can be also exported to a group distribution. If you want to export a certain dashboard to another Miradore Management Suite instance, you can do that through the Tasks menu of the Dashboard item page. |
|
Import |
This task can be used to import a dashboard into Miradore Management Suite from an XML file. Dashboards can be exported from Miradore Management Suite using the "Tasks > Export dashboard" option at the Dashboard item page. For more information, please read Exporting and importing Dashboards. Notice that dashboards containing patch management widgets cannot be imported from Miradore 5.3.0 or earlier instances to Miradore 5.4.0 due to incompatibility. |
|
|
This task sends the view contents to a printer. |
|
Tools > Set built-in dashboard as default |
This task sets the Miradore Management Suite's built-in "Main" dashboard as the default dashboard for all users. Default dashboard is shown to users when they log in to Miradore Management Suite, or when they hit the "Main" button from the top pane. |
|
Tools > Set selected dashboard as default |
With this task, it is possible to set any custom dashboard as the default home dashboard for all users. Select only one Dashboard item from the view before running the task. Default home dashboard is shown to users when they log in to Miradore Management Suite, or when they hit the "Home" button from the top pane. Miradore's built-in "Main" dashboard is shown to users who don't have enough permissions to view the defined home dashboard. |